You see a symptom (Grafana without data, an update keeps failing) and want to know which service of the edge is responsible.
Steps
-
Top-right cog → Settings → Diagnosis in the sidebar.
-
The list shows every edge service (
main-ui,datastore,grafana,idea4sbridge,iolink-proxy,mosquitto,postgres,usb-service,flecs,update-service) — each with a status dot and an N messages drawer: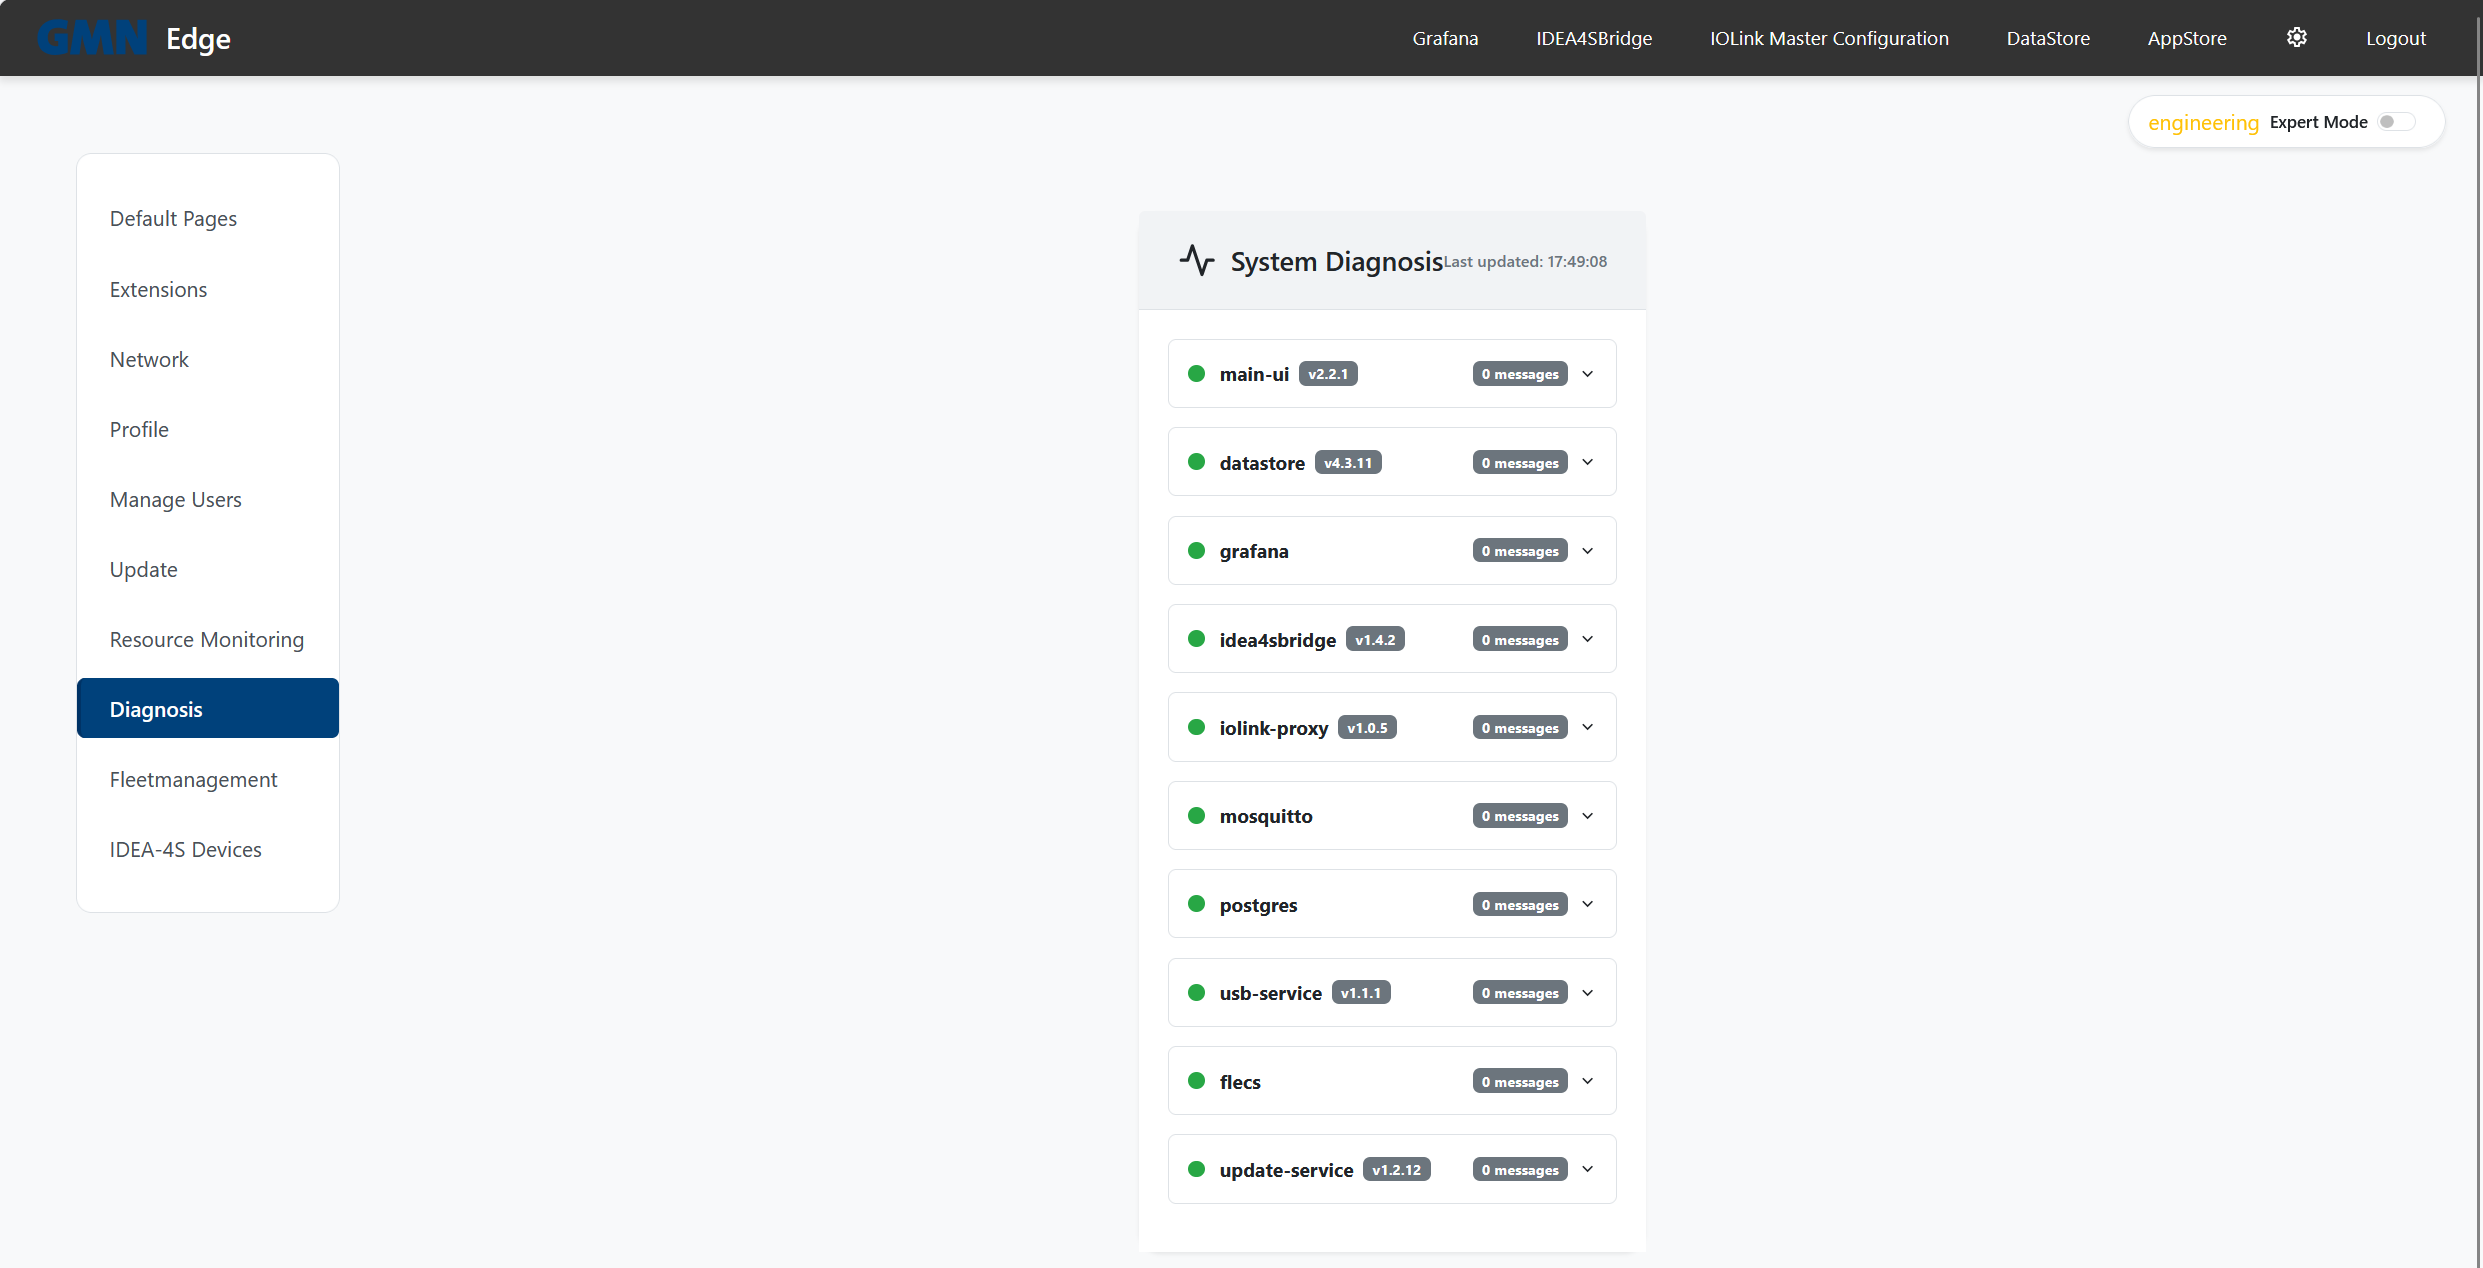
-
Read the status:
- 🟢 green → no open messages, the service considers itself healthy.
- 🟡 yellow → at least one warning. Service still runs, but something is off.
- 🔴 red → at least one error. Service may be degraded or failed.
-
For any non-green dot expand the N messages drawer — individual messages appear with their code and an explanation.
-
Look the code up in the Diagnosis codes table — it explains the meaning and the typical action.
Common patterns
- All green but Grafana has no data: usually a data-pipeline issue below the diagnosis threshold. Check the IO-Link master (see Configure IO-Link master) and the MQTT subscriptions.
update-servicered shortly after an update: the update was rolled back — the previous state is running again; see Diagnosis codes 2xxx.datastorered with code 7002 (FleetManagererror): typical right after first install, before the machine ID has been activated in the fleet — see Fleet onboarding.
If you’re stuck
Brinkhaus personnel can read the edge’s diagnosis centrally once it is connected to the FleetManager (see Fleet onboarding). Send the hotline the machine ID and the symptom; they read the codes in parallel.