Concept v2
Settings → Resource Monitoring shows the edge hardware load at a glance. Values come from the operating system directly (psutil); the Refresh button fetches a fresh sample.
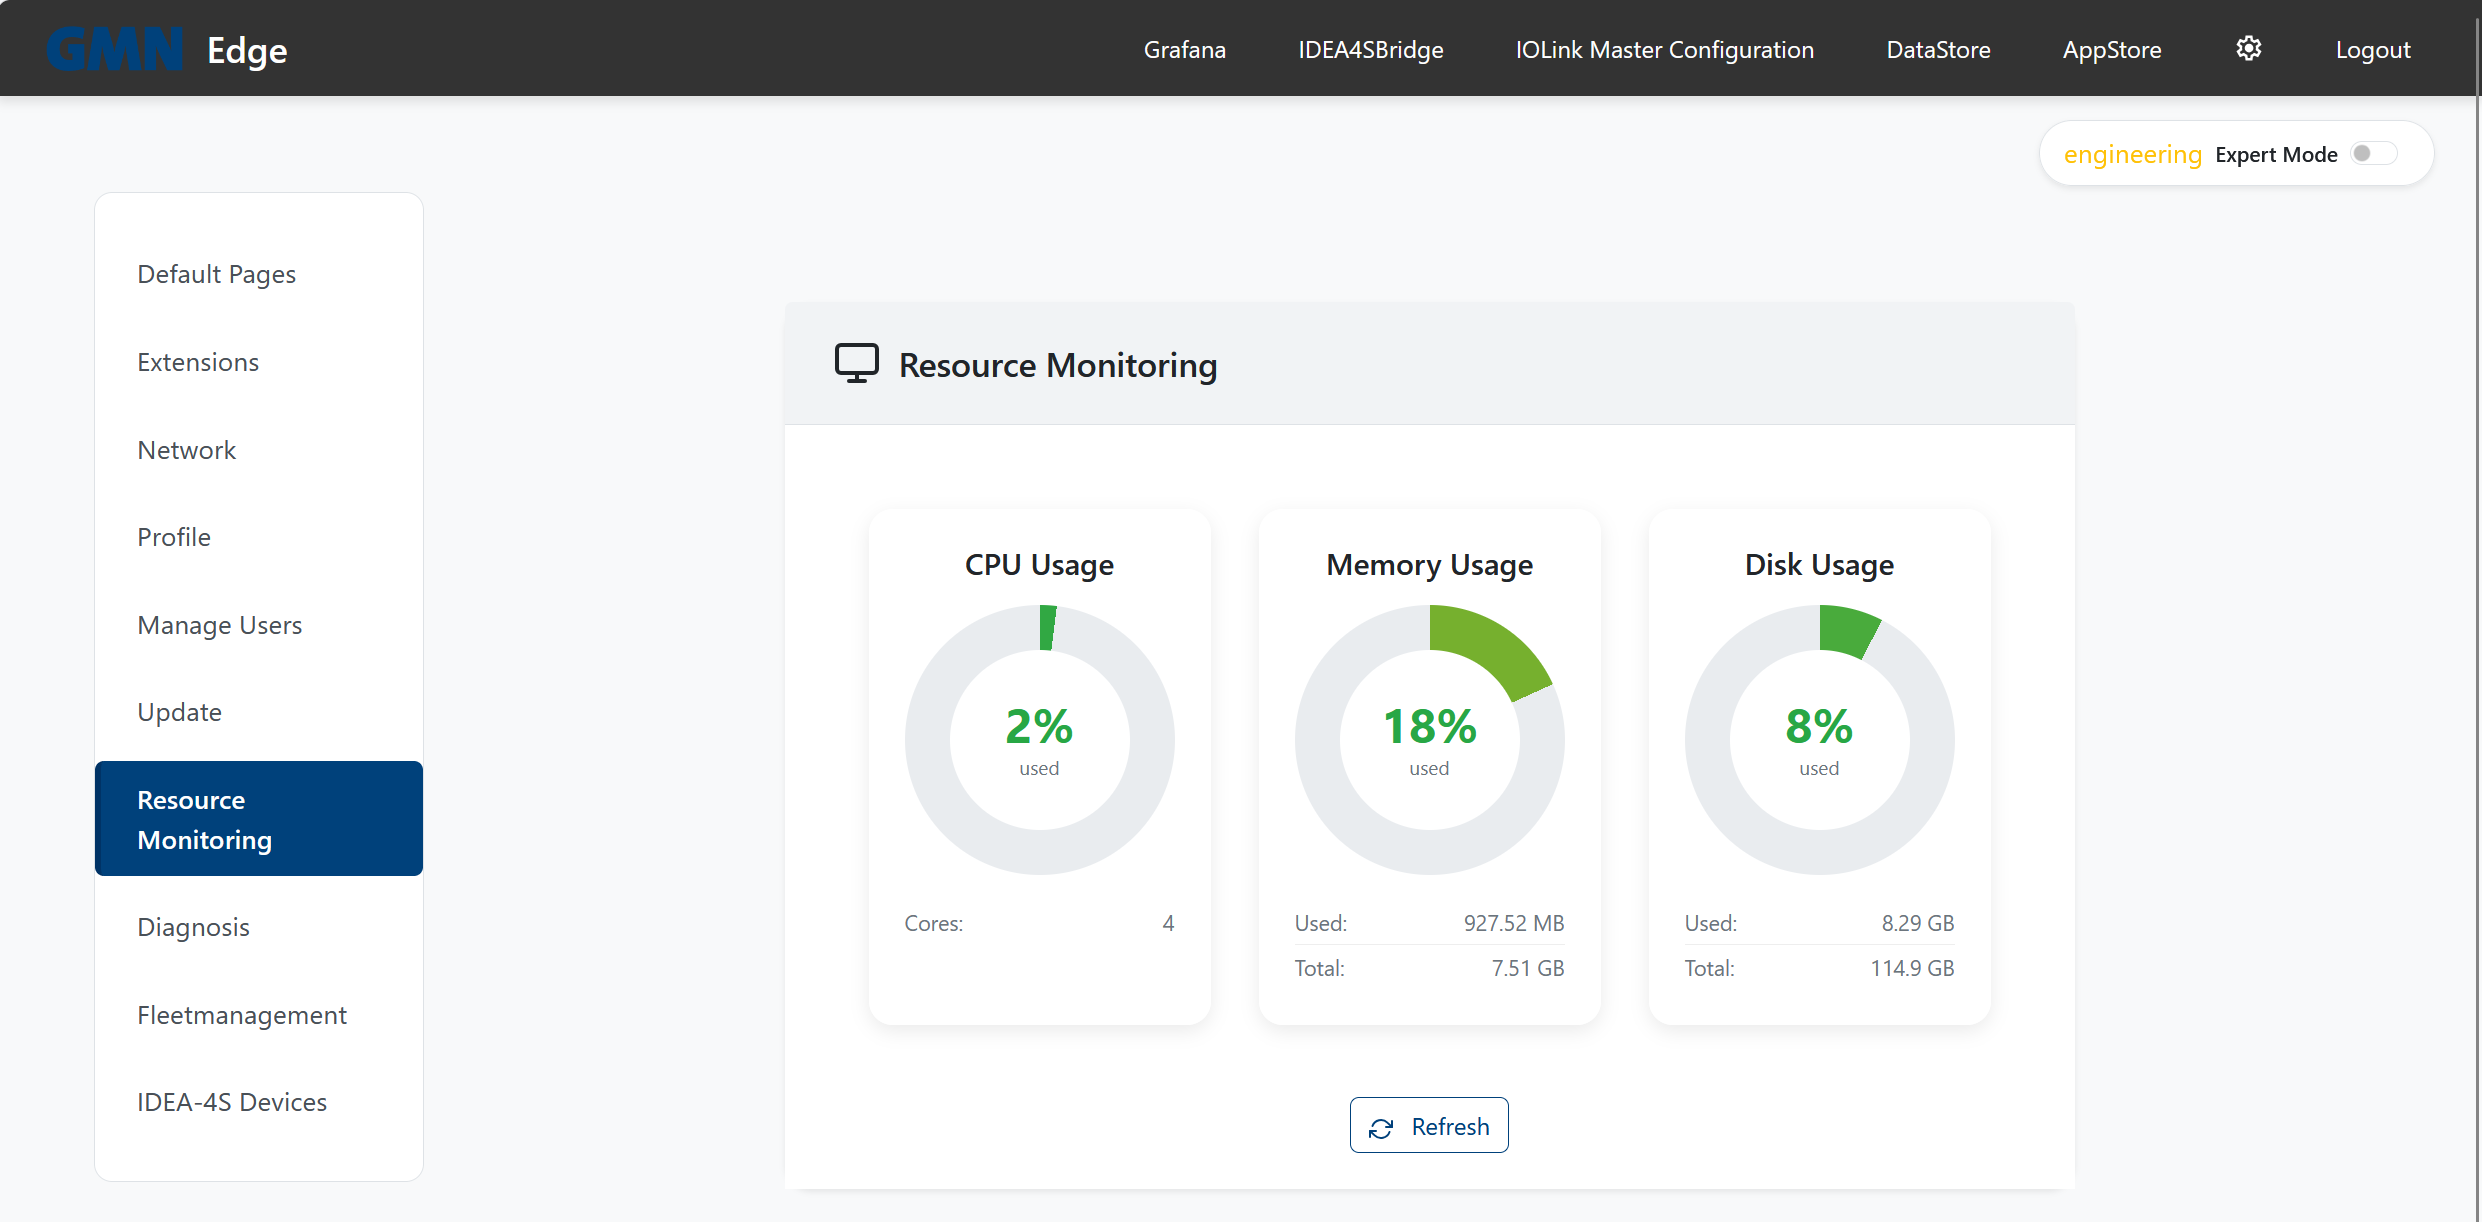
What the three charts mean
| Chart | Meaning |
|---|---|
| CPU Usage | Current load across all CPU cores (snapshot). “Cores” tells you how many cores the edge has. |
| Memory Usage | RAM in use vs total available. “Used” and “Total” are shown in MB / GB. |
| Disk Usage | Internal SSD/eMMC fill level. Firmware writes mostly logs and sensor data — fast growth usually means a misconfigured AppStore app. |
What are “normal” values?
At idle with the IDEA-4S data flow running:
- CPU: typically 1–5%. Spikes during boot or an update are normal.
- Memory: 15–25%. Drifts up slowly as container caches fill — up to ~70% is fine.
- Disk: 5–15% depending on uptime and data volume. Postgres data grows by a few hundred MB per month.
When to react
- CPU sustained > 80%: usually a runaway loop in a FLECS app or a custom dashboard. Check AppStore, stop the offending app.
- Memory > 85%: an app is leaking — the edge won’t crash itself, but new containers start more slowly. Reboot or call Brinkhaus support.
- Disk > 90%: prune logs or old Postgres tables — contact Brinkhaus support; never delete files on the edge by hand.
Where do the numbers come from?
Values are read from the edge’s host OS, not from individual containers. A single misbehaving app drives the chart up here without revealing which app — for that, look at Settings → Diagnosis, where every service reports individually.